What Rising Real Yields Means for Investors
Treasury rates have climbed to their highest levels in recent years, driven by a combination of concerns over inflation, oil prices, the national debt, and Federal Reserve policy.
The 10-year Treasury yield has once again surpassed 4.6%, and the 30-year yield has remained above 5% for the longest stretch since 2007. (1) Generally speaking, this environment is favorable for long-term investors, as higher yields better support portfolio objectives such as income generation and stability.
Perhaps even more notable is that real yields have risen by an even greater margin.
For investors, understanding these movements is valuable because they shape many dimensions of investing and financial planning. Portfolios and financial plans should carefully account for these shifting interest rate and economic conditions, particularly given how much the environment has changed over the past decade.
The distinction between nominal and real interest rates is straightforward, despite sounding technical.
A nominal yield is simply the stated rate on a bond, whether it is a corporate investment grade bond or a U.S. Treasury note. The real yield takes this a step further by reflecting what an investor earns after accounting for inflation.
Real yields represent the true return for savers, and as such serve as a key benchmark against which all other asset classes are evaluated. Given the significance of rising real yields, there are several important considerations for investors.
Long-term real yields are near multi-year highs
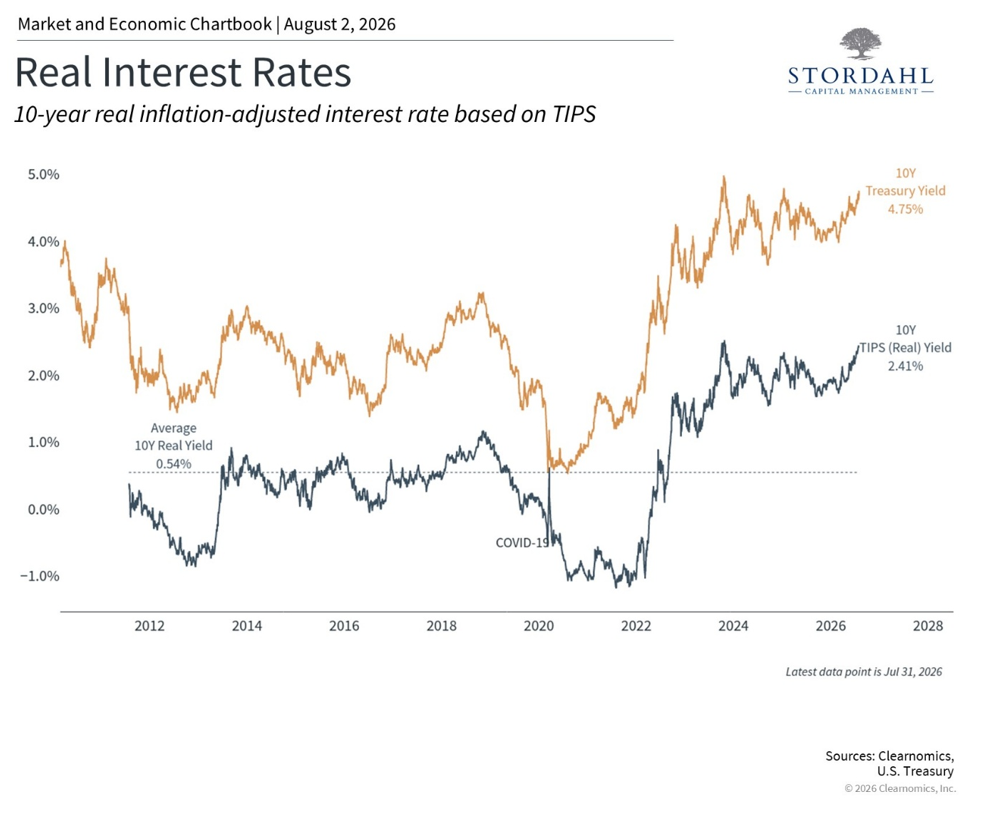
The chart above illustrates how real yields have shifted over the past decade and a half.
In 2020, real yields on government bonds actually turned negative, meaning investors were either anticipating little to no inflation in the coming years or accepting a guaranteed erosion of purchasing power in exchange for the safety of U.S. Treasury securities.
This outcome was largely intentional, as the Fed cut rates to support the economy and encourage investors toward stocks, real estate, and other higher-yielding assets.
The dynamic shifted in 2022 when inflation spiked sharply, prompting the Fed to reverse course and raise the federal funds rate at the fastest pace in decades.
Both nominal and real yields surged in response. Today, the 10-year nominal Treasury yield stands at roughly 4.7%, while the corresponding real yield is 2.4%, well above levels seen since the global financial crisis.
These figures reflect expectations of inflation over the next ten years, not just the most recent data points.
Several factors are contributing to elevated long-term yields today.
Oil prices have climbed back above $90 per barrel for Brent crude amid the ongoing war in Iran, and gasoline prices have risen back above $4 per gallon nationally. (2)
Higher energy costs can flow directly into broader inflation, which in turn pushes nominal yields upward. Notably, inflation expectations have not risen significantly based on market measures and surveys, largely because many participants anticipate that the Fed may raise rates over the coming months to address rising prices.
In addition, the growing national debt and federal budget deficit continue to create uncertainty around government bond yields. This influences what economists refer to as the "term premium," or the additional yield investors require to hold longer-term bonds.
With the total national debt now exceeding $39 trillion, increased interest payments naturally raise the government's cost of borrowing, putting further upward pressure on U.S. Treasury yields. (3)
Higher yields affect all parts of the market
Interest rates extend their influence well beyond the bond market, shaping how attractive different asset classes appear relative to one another.
This is especially relevant for long-term investors, as it affects the relative appeal of various asset classes within a balanced portfolio.
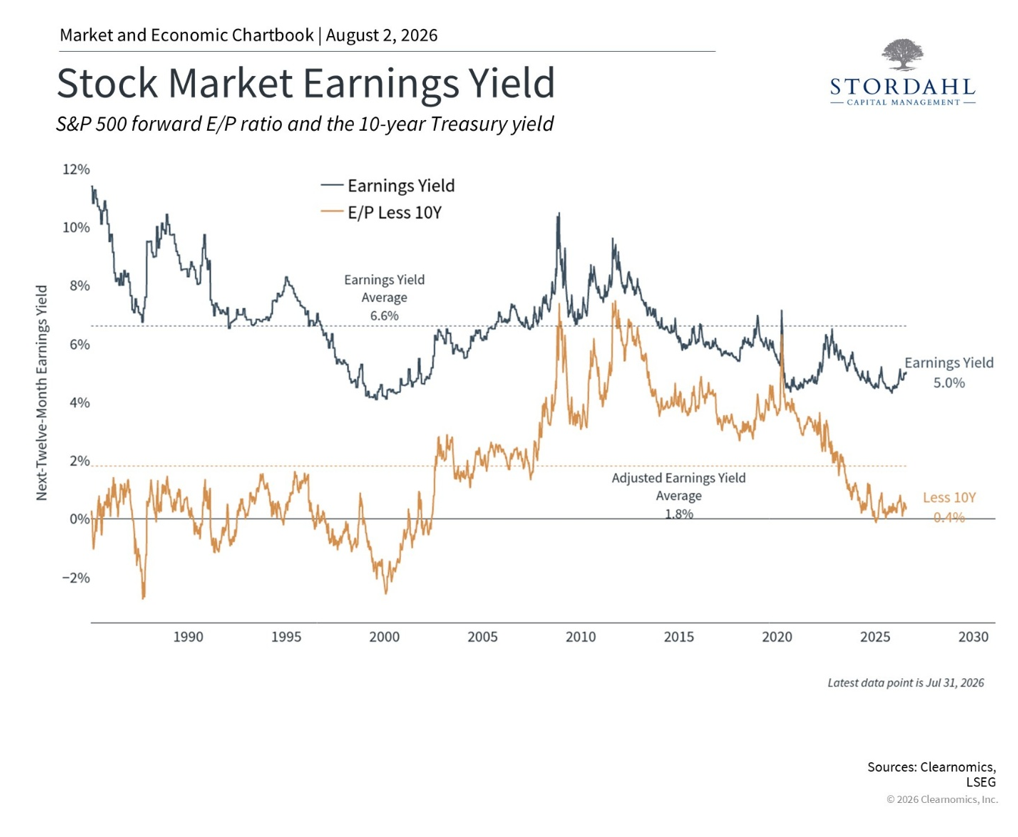
The chart above, for example, displays the S&P 500 earnings yield, which is calculated by dividing earnings-per-share by the price of the S&P 500. This valuation measure provides a useful basis for comparing the stock market against bond yields.
This comparison is often described as the "equity risk premium," as it measures the additional benefit available for accepting greater risk in the stock market.
When real bond yields were near zero or negative, as they were for much of the post-2008 period, stocks faced little competition. Investors accepted lower earnings yields from equities because few alternatives offered meaningful yield and growth potential. This environment was commonly referred to as TINA, or "there is no alternative."
At current levels, the 10-year real yield of 2.4% means investors can earn an attractive, inflation-adjusted return from government bonds.
The S&P 500 earnings yield sits at roughly 4.9%, corresponding to a forward price-to-earnings ratio of around 20x.
As a result, thoughtfully evaluating the balance of stocks and bonds within a portfolio has become potentially more consequential than in prior years. (4)
The Fed balance sheet and what it means for yields
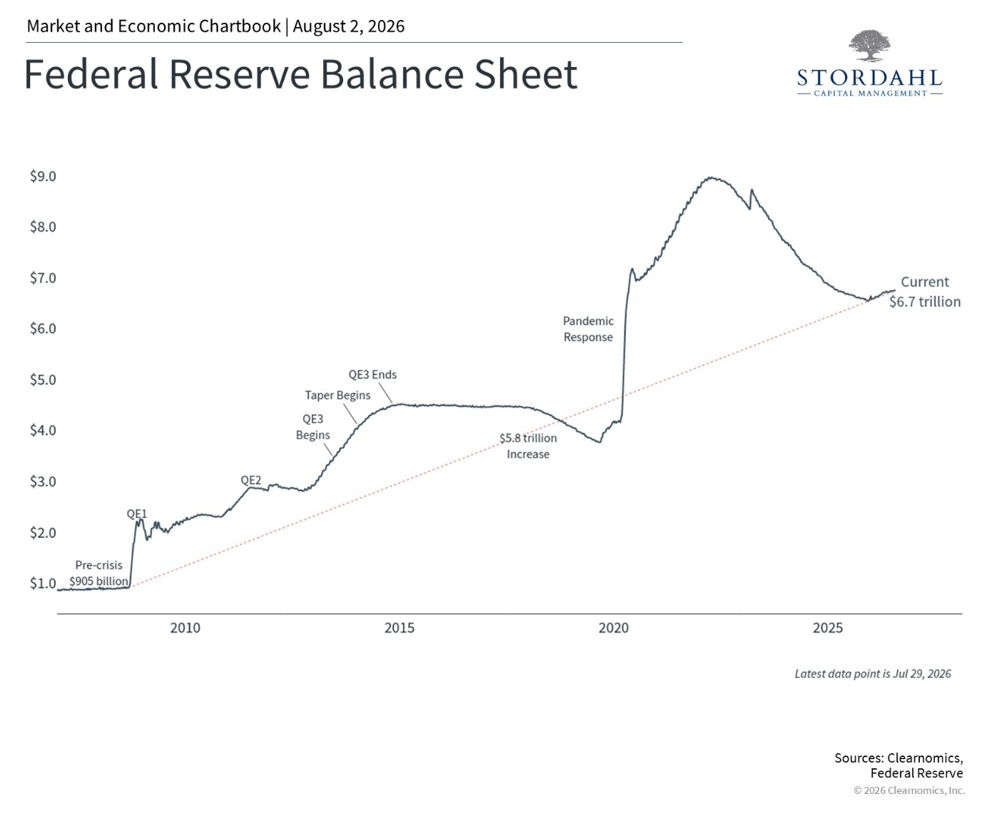
Another element influencing bond yields is the uncertainty surrounding Fed policy under the new leadership of Kevin Warsh.
One task force he has launched seeks to address the central bank's $6.7 trillion balance sheet. As the chart above shows, the Fed's asset holdings have expanded with each major economic crisis. Although the balance sheet has contracted in recent years as assets have matured, it remains substantially larger than it was prior to 2008.
Warsh has consistently held the view that the Fed should reduce its balance sheet when the economy is in good health.
This would involve selling Treasury securities and mortgage-backed securities, which effectively pushes Treasury bond yields higher and raises borrowing costs for businesses and homebuyers.
Combined with the expectation of Fed rate increases, these actions could keep both short-term and long-term interest rates elevated for an extended period.
For long-term investors, this environment underscores the importance of maintaining a thoughtful balance of stocks, bonds, and other assets designed to support their financial goals.
The bottom line? Real yields are at their highest levels in years, driven by inflation concerns, fiscal uncertainty, and a shrinking Fed balance sheet. A thoughtfully constructed and well-balanced portfolio aligned with financial plans is more important than ever.
If rising yields have you questioning your investment strategy, we offer a complimentary 15-minute call to discuss your concerns and explore how a thoughtful financial plan can help you remain focused on your long-term goals.
References
1. https://home.treasury.gov/policy-issues/financing-the-government/interest-rate-statistics
3. https://www.jec.senate.gov/public/index.cfm/republicans/debt-dashboard
4. Clearnomics research and LSEG data as of July 27, 2026
5. https://www.federalreserve.gov/monetarypolicy/task-forces.htm
Index Descriptions
S&P 500
The Standard & Poor's 500 Index is a capitalization-weighted index of 500 stocks designed to measure performance of the broad domestic economy through changes in the aggregate market value of 500 stocks representing all major industries.
A Weekly Perspective on Planning and Markets
Each week, we share The Week in Review — a short collection of articles on
financial planning and wealth management, along with a brief overview for context.
One email per week. No promotions, no sales – just clarity.
This material was written in collaboration with artificial intelligence (ChatGPT) and derived from sources believed to be correct.
Stordahl Capital Management, Inc is a Registered Investment Adviser. This commentary is solely for informational purposes and reflects the personal opinions, viewpoints, and analyses of Stordahl Capital Management, Inc. and should not be regarded as a description of advisory services or performance returns of any SCM Clients. The views reflected in the commentary are subject to change at any time without notice. Nothing in this piece constitutes investment advice, performance data or any recommendation that any particular security, portfolio of securities, transaction or investment strategy is suitable for any specific person. Any mention of a particular security and related performance data is not a recommendation to buy or sell that security. Advisory services are only offered to clients or prospective clients where Stordahl Capital Management and its representatives are properly licensed or exempt from licensure. No advice may be rendered by Stordahl Capital Management unless a client service agreement is in place. Stordahl Capital Management, Inc provides links for your convenience to websites produced by other providers or industry-related material. Accessing websites through links directs you away from our website. Stordahl Capital Management is not responsible for errors or omissions in the material on third-party websites and does not necessarily approve of or endorse the information provided. Users who gain access to third-party websites may be subject to the copyright and other restrictions on use imposed by those providers and assume responsibility and risk from the use of those websites. Please note that trading instructions through email, fax, or voicemail will not be taken. Your identity and timely retrieval of instructions cannot be guaranteed. Stordahl Capital Management, Inc. manages its clients’ accounts using a variety of investment techniques and strategies, which are not necessarily discussed in the commentary. Investments in securities involve the risk of loss. Past performance is no guarantee of future results.
Copyright (c) 2024 Clearnomics, Inc. All rights reserved. The information contained herein has been obtained from sources believed to be reliable, but is not necessarily complete and its accuracy cannot be guaranteed. No representation or warranty, express or implied, is made as to the fairness, accuracy, completeness, or correctness of the information and opinions contained herein. The views and the other information provided are subject to change without notice. All reports posted on or via www.clearnomics.com or any affiliated websites, applications, or services are issued without regard to the specific investment objectives, financial situation, or particular needs of any specific recipient and are not to be construed as a solicitation or an offer to buy or sell any securities or related financial instruments. Past performance is not necessarily a guide to future results. Company fundamentals and earnings may be mentioned occasionally, but should not be construed as a recommendation to buy, sell, or hold the company's stock. Predictions, forecasts, and estimates for any and all markets should not be construed as recommendations to buy, sell, or hold any security--including mutual funds, futures contracts, and exchange traded funds, or any similar instruments. The text, images, and other materials contained or displayed in this report are proprietary to Clearnomics, Inc. and constitute valuable intellectual property. All unauthorized reproduction or other use of material from Clearnomics, Inc. shall be deemed willful infringement(s) of this copyright and other proprietary and intellectual property rights, including but not limited to, rights of privacy. Clearnomics, Inc. expressly reserves all rights in connection with its intellectual property, including without limitation the right to block the transfer of its products and services and/or to track usage thereof, through electronic tracking technology, and all other lawful means, now known or hereafter devised. Clearnomics, Inc. reserves the right, without further notice, to pursue to the fullest extent allowed by the law any and all criminal and civil remedies for the violation of its rights.