The Week in Review: November 2, 2026
The American Economy Is Stronger Than It Appears
Sluggish job growth and weak consumer confidence might suggest an economy struggling to maintain momentum. Yet recent economic data tells a different story.
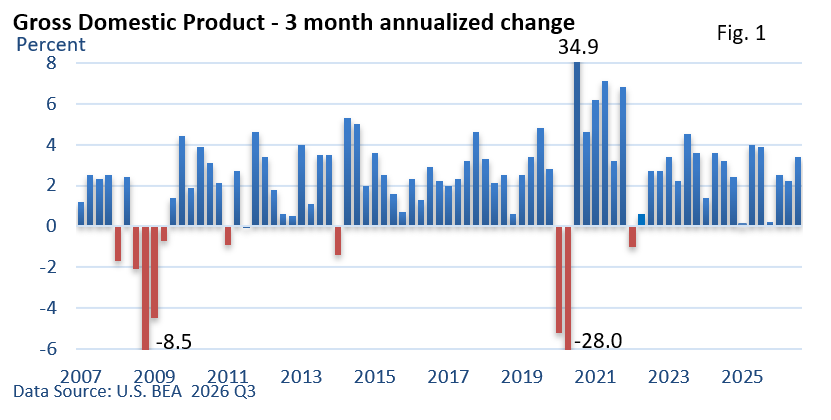
According to the Bureau of Economic Analysis, the U.S. economy expanded at a healthy 3.4% annualized rate in the third quarter, reflecting continued strength despite concerns about inflation, employment, and the economic outlook.
What Is Driving Economic Growth?
Two factors stand out: consumer spending and business investment.
American consumers continue to spend despite higher gasoline prices and persistent concerns about the cost of living. So far, rising prices at the pump have not significantly reduced spending in other areas of the economy.
At the same time, investment in artificial intelligence is providing a substantial boost to economic activity. Businesses are spending heavily on data centers, computing equipment, and related infrastructure to support the growing use of AI.
One measure of economic activity that reflects demand from businesses and households increased at a 4.9% annualized rate, its strongest pace since 2021.
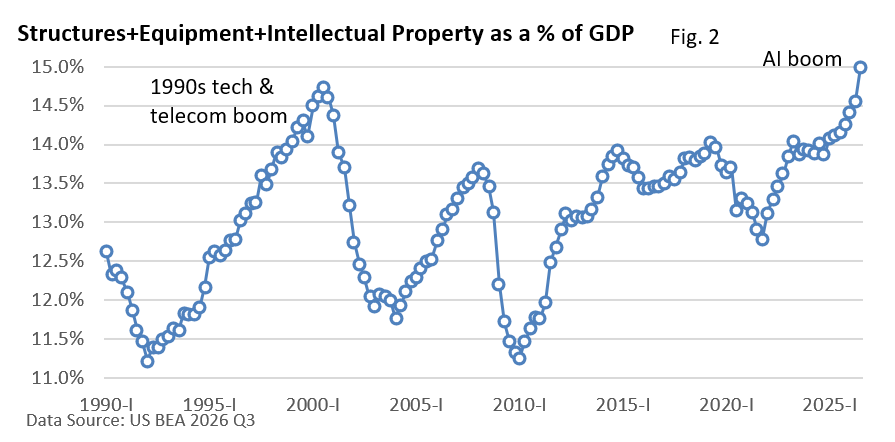
Although the chart reflects investment across industries, AI-related spending has become an important contributor to that growth.
Keeping the Economic Picture in Perspective
Economic uncertainty has not disappeared, and it never will. Consumer sentiment, employment trends, and geopolitical developments will continue to influence the outlook.
But it is important to distinguish how people feel about the economy from what the economic data actually shows.
For now, the evidence points to an economy that continues to expand at a healthy pace, supported by consumer spending and substantial business investment.
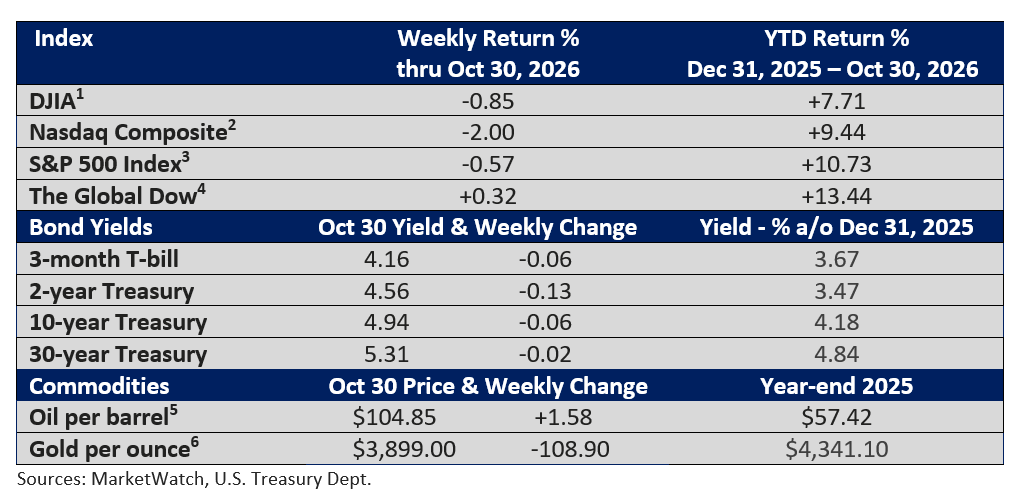
Market summary
TWO FOR THE ROAD
An analysis from The Economist finds that in the vast majority of wealthy countries, millennials have higher inflation-adjusted incomes than previous generations did at the same age. - The Economist, October 18, 2026
According to the Tax Foundation, the top 1% of taxpayers earned 20.6% of adjusted gross income in 2023 but paid 38.4% of all federal individual income taxes. The top 5% earned 36.4% of income and paid 59.3% of taxes, while the top 25% earned 68.5% of income and paid 86.3% of federal individual income taxes.
By comparison, the bottom 50% of taxpayers paid just 3.3% of federal individual income taxes. – Tax Foundation, April 15, 2026
I hope you have a great week!
Warmest Regards,
Bill Stordahl, CFP®
Managing Director
Stordahl Capital Management
A Weekly Perspective on Planning and Markets
Each week, we share The Week in Review — a short collection of articles on
financial planning and wealth management, along with a brief overview for context.
One email per week. No promotions, no sales – just clarity.
Stordahl Capital Management, Inc is a Registered Investment Adviser. This commentary is solely for informational purposes and reflects the personal opinions, viewpoints, and analyses of Stordahl Capital Management, Inc. and should not be regarded as a description of advisory services or performance returns of any SCM Clients. The views reflected in the commentary are subject to change at any time without notice. Nothing in this piece constitutes investment advice, performance data or any recommendation that any particular security, portfolio of securities, transaction or investment strategy is suitable for any specific person. Any mention of a particular security and related performance data is not a recommendation to buy or sell that security. Advisory services are only offered to clients or prospective clients where Stordahl Capital Management and its representatives are properly licensed or exempt from licensure. No advice may be rendered by Stordahl Capital Management unless a client service agreement is in place. Stordahl Capital Management, Inc provides links for your convenience to websites produced by other providers or industry-related material. Accessing websites through links directs you away from our website. Stordahl Capital Management is not responsible for errors or omissions in the material on third-party websites and does not necessarily approve of or endorse the information provided. Users who gain access to third-party websites may be subject to the copyright and other restrictions on use imposed by those providers and assume responsibility and risk from the use of those websites. Please note that trading instructions through email, fax, or voicemail will not be taken. Your identity and timely retrieval of instructions cannot be guaranteed. Stordahl Capital Management, Inc. manages its clients’ accounts using a variety of investment techniques and strategies, which are not necessarily discussed in the commentary. Investments in securities involve the risk of loss. Past performance is no guarantee of future results.
1. The Dow Jones Industrials Average is an unmanaged index of 30 major companies which cannot be invested into directly. Past performance does not guarantee future results.
2. The NASDAQ Composite is an unmanaged index of companies which cannot be invested into directly. Past performance does not guarantee future results.
3. The S&P 500 Index is an unmanaged index of 500 larger companies which cannot be invested into directly. Past performance does not guarantee future results.
4. The Global Dow is an unmanaged index composed of stocks of 150 top companies. It cannot be invested into directly. Past performance does not guarantee future results.
5. CME Group front-month contract; Prices can and do vary; past performance does not guarantee future results.
6. CME Group continuous contract; Prices can and do vary; past performance does not guarantee future results.