The Week in Review: March 9, 2026
The War and Its Impact—So Far
What is the efficient market theory? Textbooks have been written to fully explain the theory. But if we can sum it up in one sentence: Assets, such as stocks, reflect all publicly available information. It is a foundational principle of finance.
You might be wondering, “With everything happening in the world right now, why open this week’s Insights with a wonky principle straight from the halls of academia?”
Fair question—so let’s address it. When new information emerges about companies or economic indicators, investors quickly incorporate that data—prices change. So, major indexes rise or fall in response to that updated information. The same principle is happening right now.
Investors are viewing the war through an economic lens, and the unknowns make it difficult to fully price into equities. For example, how long will hostilities last? And what will happen to oil prices since the Strait of Hormuz—a key conduit for global oil—is closed?
Almost 20% of the world’s oil flows through the Strait, according to the International Energy Agency (IEA), or about 20 million barrels per day (bpd).
Investors are reacting to economic uncertainty stemming from oil disruptions, along with the possibility of higher inflation and slower economic growth. But not all assets considered a “safe haven” gained ground last week. Let’s review the table below.
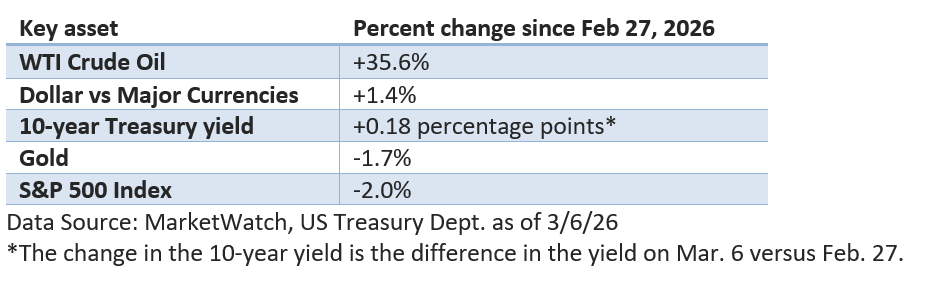
Oil prices have surged, and the US dollar, long viewed as a safe haven during periods of global turmoil, has once again strengthened as global investors seek shelter.
Yet investors aren’t seeking safety in Treasury bonds. Remember, yields and bond prices move in the opposite direction. While Treasuries have traditionally served as a safe haven during periods of heightened uncertainty, inflation fears have limited their appeal in the current environment. Meanwhile, gold, typically a go-to hedge in periods of turmoil, finished the week lower.
Considering the scale of events unfolding in the Middle East, last week’s 2.0% decline in the S&P 500 looks relatively modest. It would suggest that at this time investors aren’t expecting an extended, disruptive war.
Dissecting oil’s rise
First, the US is the world's largest producer of oil and natural gas. While natural gas prices have soared in Europe, they have been stable in the US. The US is a net exporter of natural gas, and the war has had little effect on domestic prices.
But oil doesn’t follow the same pattern. It’s far easier to transport globally than natural gas.
While there are alternative pipelines that could avoid the Strait, it amounts to roughly 5 million bpd, according to the IEA.
The silver lining: about 85% of that product found its way to Asia last year. Only about 3% made its way to the Americas. In 2025, all of Iran’s exports, about 1.6 million bpd, flowed to China.
Today, the US imports more oil than it exports (3.7 million bpd deficit), but it exports more refined products (gasoline, propane, diesel, etc.) than it imports (5.6 million bpd surplus), according to the US Energy Information Administration. Simple math: the US is a net exporter.
While the US is probably immune to shortages, it’s not immune to higher prices. The price of a gallon of regular is up 41 cents per gallon over the last week to about $3.39 through March 6, according to Gasbuddy.com.
Will the administration and other nations release oil from their respective Strategic Petroleum Reserves? Currently, the US is reviewing its options, but there are no active discussions; in part, reserves were drawn down during 2022 and were only partially replaced.
For now, the IEA believes there are ample global reserves.
Final thoughts
Looking to the near term, volatility is likely to continue, and headlines, both encouraging and discouraging, could whipsaw trading.
Signs that oil is starting to move through the Strait or any talk of a deal that could end hostilities could create a powerful short-term tailwind for stocks.
Nonetheless, periods of geopolitical tension can unsettle markets, but they don’t normally alter the long-term trajectory of well-constructed financial plans. We’ll continue to monitor developments closely and keep you informed.
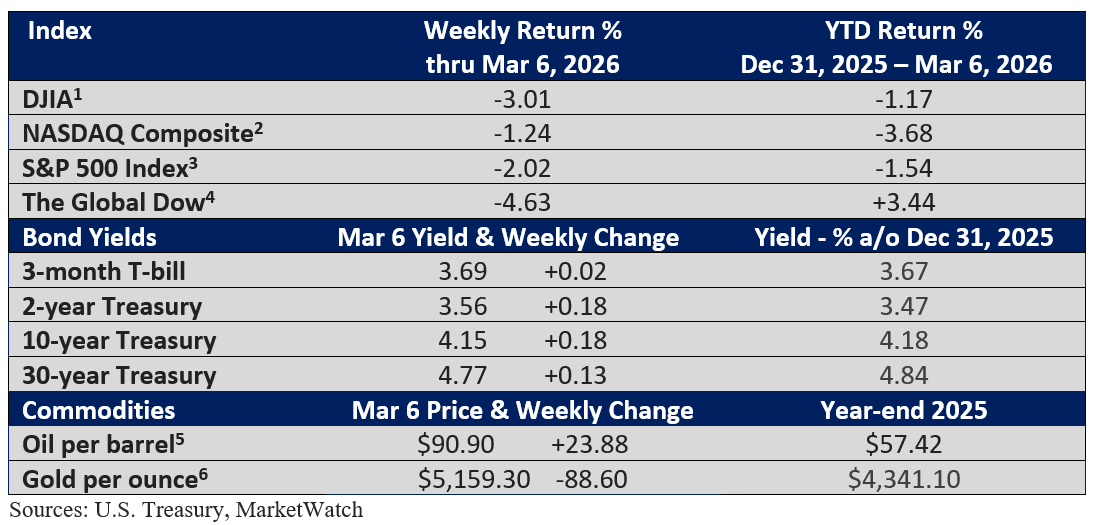
Market Summary
Two FOR THE ROAD
Apple has bought back $709 billion in stock over the past 10 years, which is greater than the market cap of 487 companies in the S&P 500. – WSJ, November 3, 2025
In fiscal year 2025, Costco sold over 245 million hotdog combos, over 157 million rotisserie chickens, and enough bath tissue to reach the moon and back over 200 times. - The Transcript, September 29, 2025
Please let me know if you have any questions or concerns that you would like to discuss.
I hope you have a wonderful week!
Warmest Regards,
Bill Stordahl, CFP®
Managing Director
Stordahl Capital Management
A Weekly Perspective on Planning and Markets
Each week, we share The Week in Review — a short collection of articles on
financial planning and wealth management, along with a brief overview for context.
One email per week. No promotions, no sales – just clarity.
Stordahl Capital Management, Inc is a Registered Investment Adviser. This commentary is solely for informational purposes and reflects the personal opinions, viewpoints, and analyses of Stordahl Capital Management, Inc. and should not be regarded as a description of advisory services or performance returns of any SCM Clients. The views reflected in the commentary are subject to change at any time without notice. Nothing in this piece constitutes investment advice, performance data or any recommendation that any particular security, portfolio of securities, transaction or investment strategy is suitable for any specific person. Any mention of a particular security and related performance data is not a recommendation to buy or sell that security. Advisory services are only offered to clients or prospective clients where Stordahl Capital Management and its representatives are properly licensed or exempt from licensure. No advice may be rendered by Stordahl Capital Management unless a client service agreement is in place. Stordahl Capital Management, Inc provides links for your convenience to websites produced by other providers or industry-related material. Accessing websites through links directs you away from our website. Stordahl Capital Management is not responsible for errors or omissions in the material on third-party websites and does not necessarily approve of or endorse the information provided. Users who gain access to third-party websites may be subject to the copyright and other restrictions on use imposed by those providers and assume responsibility and risk from the use of those websites. Please note that trading instructions through email, fax, or voicemail will not be taken. Your identity and timely retrieval of instructions cannot be guaranteed. Stordahl Capital Management, Inc. manages its clients’ accounts using a variety of investment techniques and strategies, which are not necessarily discussed in the commentary. Investments in securities involve the risk of loss. Past performance is no guarantee of future results.
1. The Dow Jones Industrials Average is an unmanaged index of 30 major companies which cannot be invested into directly. Past performance does not guarantee future results.
2. The NASDAQ Composite is an unmanaged index of companies which cannot be invested into directly. Past performance does not guarantee future results.
3. The S&P 500 Index is an unmanaged index of 500 larger companies which cannot be invested into directly. Past performance does not guarantee future results.
4. The Global Dow is an unmanaged index composed of stocks of 150 top companies. It cannot be invested into directly. Past performance does not guarantee future results.
5. CME Group front-month contract; Prices can and do vary; past performance does not guarantee future results.
6. CME Group continuous contract; Prices can and do vary; past performance does not guarantee future results.