
The Week in Review: August 31, 2026
Location, Location, Location
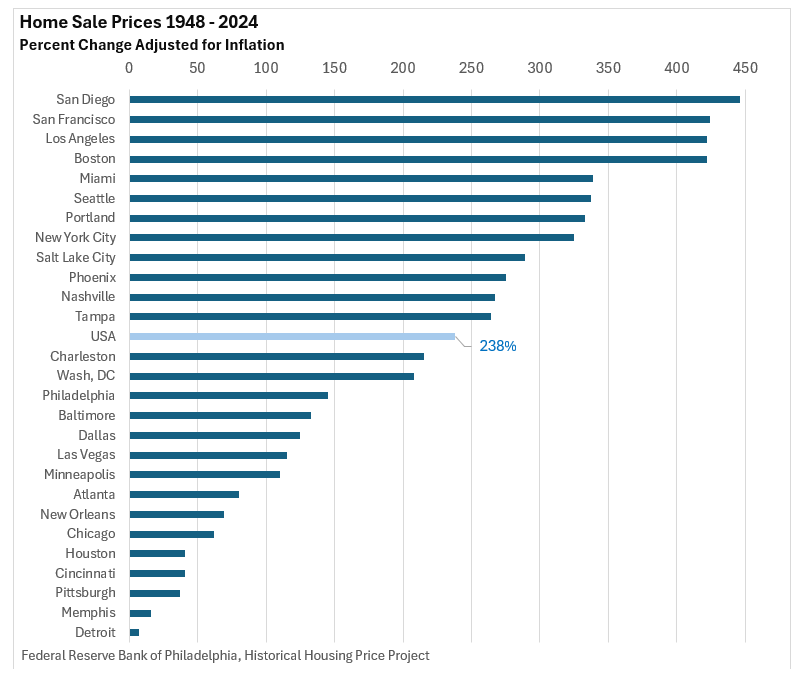
The graphic below compares the change in home prices, adjusted for inflation, for various US cities.
For example, the average USA home price has topped inflation by 238% since 1948.
Why has there been such a wide trajectory in prices, and why have they proven so persistent?
For example, the top 8 cities are on the coasts, while the bottom cities are far from the Atlantic and Pacific. Yet, Philadelphia and Baltimore, a stone’s throw from the Atlantic Ocean, have trailed Boston and New York.
To answer these questions, we need to look at supply, not just demand.
In theory, demand for new housing will bid up the price of existing homes, increasing the incentive for developers to build new houses.
If housing supply is reasonably elastic, which means that new construction is generated in response to a jump in prices, then real housing prices (prices adjusted for inflation) should eventually fall. Over time, price levels should remain reasonably steady.
However, if demand from homebuyers cannot be met, whether due to regulatory obstacles, zoning restrictions, or a limited supply of developable land, upward pressure on prices seems likely as inventory struggles to keep pace with demand.
Let’s review real-life examples. The Philadelphia Federal Reserve noted that steady demand for housing was met with regular growth in housing construction in Atlanta. The same could be said of Houston. Overall prices in both cities have trailed the U.S. average.
Compare that to Los Angeles and New York.
Although prices relative to construction costs began to surge in Los Angeles in the 1970s and New York City in the 1980s, permitting reveals that construction per capita levels barely budged in both cities.
In fact, New York City built more new homes in total in 1927 than in the entire period from 1965 to 1987.
But if we examine the industrial heartland through the eyes of Philadelphia, we see a different picture.
The relative stability in Philadelphia means that existing housing supply after World War II was sufficient to meet future demand, according to the Philadelphia Federal Reserve. Prices remained relatively stable versus inflation without a major boom in construction.
Could construction costs be playing a role? Not necessarily.
In some markets, housing prices are much higher than construction costs. This has led some researchers to conclude that regulatory hurdles to new construction, including zoning and permitting constraints, may have artificially inflated prices.
In conclusion, it appears that today's prices and availability have been largely shaped by yesterday's policies and construction decisions. Housing demand varies over time, but some cities have been more responsive to new demand than others.
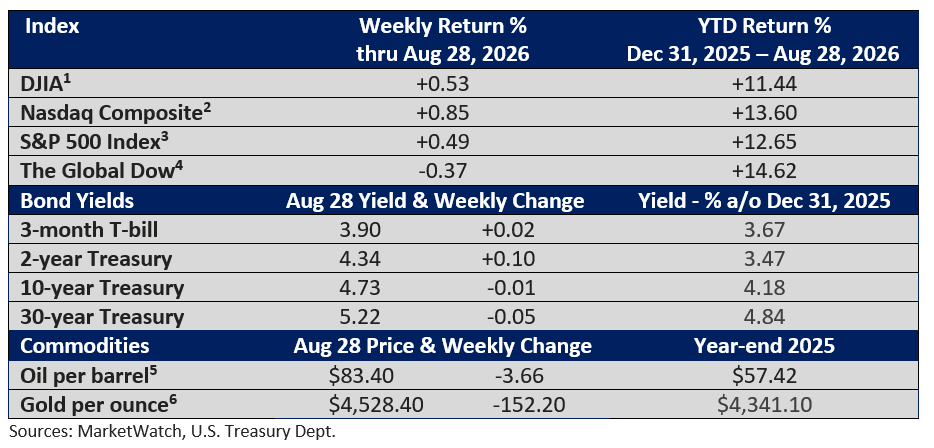
Market summary
TWO FOR THE ROAD
More than half of American workers now use AI on the job, up from just 27% two years ago. That's basically double in two years… and for the first time ever, adoption has crossed the halfway mark. The most common use isn't anything fancy either... it's just drafting, revising, and finding information faster. U.S. News & World Report, July 21, 2026
Turns out AI spending in corporate America is not exactly evenly distributed. The top 1% of U.S. businesses spent a median of $7,400 per employee on AI in July alone… more than 600 times what the typical company spent. The next tier down, the top 10%, spent about $650. Everyone else? Roughly $12. PYMNTS, August 17, 2026
I hope you have a great week!
Warmest Regards,
Bill Stordahl, CFP®
Managing Director
Stordahl Capital Management
A Weekly Perspective on Planning and Markets
Each week, we share The Week in Review — a short collection of articles on
financial planning and wealth management, along with a brief overview for context.
One email per week. No promotions, no sales – just clarity.
Stordahl Capital Management, Inc is a Registered Investment Adviser. This commentary is solely for informational purposes and reflects the personal opinions, viewpoints, and analyses of Stordahl Capital Management, Inc. and should not be regarded as a description of advisory services or performance returns of any SCM Clients. The views reflected in the commentary are subject to change at any time without notice. Nothing in this piece constitutes investment advice, performance data or any recommendation that any particular security, portfolio of securities, transaction or investment strategy is suitable for any specific person. Any mention of a particular security and related performance data is not a recommendation to buy or sell that security. Advisory services are only offered to clients or prospective clients where Stordahl Capital Management and its representatives are properly licensed or exempt from licensure. No advice may be rendered by Stordahl Capital Management unless a client service agreement is in place. Stordahl Capital Management, Inc provides links for your convenience to websites produced by other providers or industry-related material. Accessing websites through links directs you away from our website. Stordahl Capital Management is not responsible for errors or omissions in the material on third-party websites and does not necessarily approve of or endorse the information provided. Users who gain access to third-party websites may be subject to the copyright and other restrictions on use imposed by those providers and assume responsibility and risk from the use of those websites. Please note that trading instructions through email, fax, or voicemail will not be taken. Your identity and timely retrieval of instructions cannot be guaranteed. Stordahl Capital Management, Inc. manages its clients’ accounts using a variety of investment techniques and strategies, which are not necessarily discussed in the commentary. Investments in securities involve the risk of loss. Past performance is no guarantee of future results.
1. The Dow Jones Industrials Average is an unmanaged index of 30 major companies which cannot be invested into directly. Past performance does not guarantee future results.
2. The NASDAQ Composite is an unmanaged index of companies which cannot be invested into directly. Past performance does not guarantee future results.
3. The S&P 500 Index is an unmanaged index of 500 larger companies which cannot be invested into directly. Past performance does not guarantee future results.
4. The Global Dow is an unmanaged index composed of stocks of 150 top companies. It cannot be invested into directly. Past performance does not guarantee future results.
5. CME Group front-month contract; Prices can and do vary; past performance does not guarantee future results.
6. CME Group continuous contract; Prices can and do vary; past performance does not guarantee future results.