How Current Earnings Reports Illuminate Tariff Effects
Investors typically examine corporate earnings to gauge business performance, but this earnings season holds particular significance given the trade policy environment. Despite major equity indices achieving record levels amid stabilizing trade relationships, questions remain about tariff impacts on consumers and companies. Encouragingly, fresh trade deals continue to emerge while businesses report results that surpass forecasts.
Recent data indicates consumer expenditure stays robust while corporate profit growth outpaces projections. The Yale Budget Lab reports consumers encounter an average effective tariff rate of 20.2% as of July 23, representing the highest level observed since 1911.1 The absence of this impact in consumer spending metrics suggests businesses may be absorbing tariff expenses rather than immediately transferring costs to customers. Companies seem capable of this approach due to solid earnings expansion and robust profit margins.
More precisely, among the roughly one-third of S&P 500 firms that have disclosed second-quarter results, 80% delivered positive earnings-per-share surprises, while the blended earnings growth rate of 6.4% surpassed projections of 4.9%, per FactSet data.2 Though this growth pace trails recent quarters, it indicates an "earnings recession" – meaning a steep decline in corporate profits like those seen in 2020 or 2022 – appears less probable than initially anticipated.
Corporate earnings are beating expectations so far.

What mechanisms govern tariff payment, and how might these appear in financial data? While tariffs generate government revenue, the actual burden falls on either U.S. exporters or domestic consumers and businesses through elevated prices. The distribution between these groups hinges on their respective "pricing power."
Consider the U.S. dependence on "rare earth metals" for electronics, with nearly all supplies imported. Given limited alternative sources, tariffs would likely transfer directly to consumers. This explains why the administration has pursued agreements expanding rare earth metal imports from China and why domestic production interest has grown.
Conversely, the automotive sector features intense competition among domestic manufacturers and numerous countries seeking U.S. export opportunities. Should tariffs target vehicles from one nation, those producers might absorb portions of the costs to maintain competitiveness against vehicles from other countries and domestic makers.
Therefore, short-term tariff effects depend on industry competitiveness and whether consumers and businesses possess alternatives. Over longer periods, supply chains can adjust to new circumstances and currency values may shift.
Consequently, tariff impacts on earnings and corporate responses differ significantly across industries. General Motors reported tariffs reduced profits by $1.1 billion during the second quarter, with profit margins declining from 9% to 6.1%.3 Conversely, Cleveland-Cliffs, a U.S. flat-rolled steel producer, announced second-quarter earnings exceeding expectations, benefiting from tariffs that curtailed steel imports.4
The above chart demonstrates how earnings expectations vary considerably across sectors, partially reflecting trade impacts. Understanding tariffs' complete effects on companies may require several quarters, particularly as new trade agreements emerge.
Multiple countries have reached new arrangements, some featuring substantially lower tariffs than those initially announced on April 2. Recent announcements indicate the European Union and Japan will encounter 15% tariffs on U.S. exports, while Indonesia and the Philippines face 19% tariffs. Meanwhile, discussions with China continue following earlier progress on a trade truce.
Markets continue to reach new all-time highs.
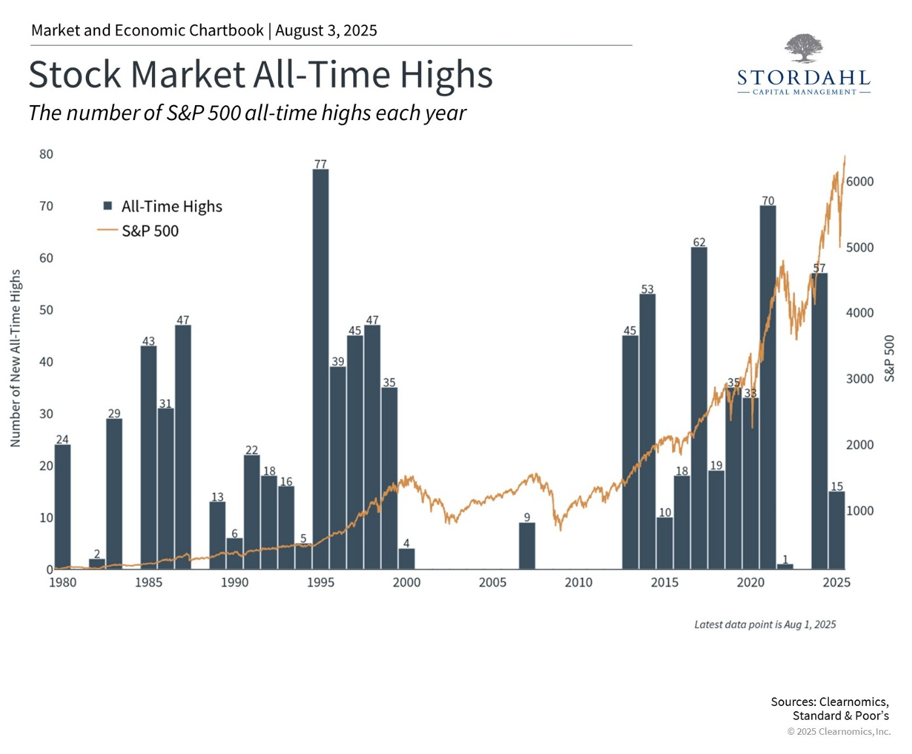
Financial markets have sustained their climb to record levels as earnings surprises emerge alongside new trade agreements. The above chart shows the S&P 500 achieving over a dozen new peaks this year, with most occurring in recent weeks. The Nasdaq has similarly reached historic levels, surpassing its previous December record, while the Dow approaches new highs. Though current market levels may concern some investors, major indices frequently establish numerous records annually during expansionary periods.
While markets perform strongly, tariff-related economic concerns persist. Various economic projections, including Federal Reserve forecasts, suggest inflation might run slightly higher with somewhat slower growth. Industry-specific impacts will reflect input costs, with import-dependent sectors facing compressed profit margins. However, these projections must consider domestic investment benefits and companies' potential adaptation through innovation and enhanced efficiency.
Although tariffs reach historically elevated levels, predictability matters more, as stable business environments enable companies to adjust operations and supply chains effectively. Looking ahead, current Wall Street consensus projects S&P 500 earnings growing at a 9.5% annual rate. These forecasts anticipate accelerating growth over the coming two years as global trade stabilizes, though significant changes could occur.
Earnings are an important long-term driver of returns.

Equity markets typically track corporate earnings over extended periods. The accompanying chart reveals that while S&P 500 prices and earnings don't align precisely, they follow similar broad patterns. This occurs because economic expansion drives earnings higher, subsequently pushing stock prices upward. Although the economy and stock market aren't identical, they connect closely through company performance.
This relationship demonstrates how tariff effects on profits can influence investors. Whether markets appear "cheap" or "expensive" depends not solely on stock prices but also corporate results. The price-to-earnings ratio simply divides stock or index prices by earnings measures, such as projected twelve-month earnings.
This means even stable prices combined with rising earnings make markets more attractive, and the reverse applies. The current S&P 500 price-to-earnings ratio stands at 22.2x, significantly above the historical 15.8x average and approaching the dot-com bubble peak of 24.5x. Present earnings trends appear positive, but continued market attractiveness will depend on economic growth and earnings performance.
The bottom line? This earnings season may offer valuable insights into tariff effects on consumers and businesses. For investors, comprehending these developments while maintaining focus on long-term planning remains the optimal approach to reaching financial objectives.
Questions? We offer a complimentary 15-minute call to discuss your concerns and explore how we can assist you.
Stordahl Capital Management, Inc is a Registered Investment Adviser. This commentary is solely for informational purposes and reflects the personal opinions, viewpoints, and analyses of Stordahl Capital Management, Inc. and should not be regarded as a description of advisory services or performance returns of any SCM Clients. The views reflected in the commentary are subject to change at any time without notice. Nothing in this piece constitutes investment advice, performance data or any recommendation that any particular security, portfolio of securities, transaction or investment strategy is suitable for any specific person. Any mention of a particular security and related performance data is not a recommendation to buy or sell that security. Advisory services are only offered to clients or prospective clients where Stordahl Capital Management and its representatives are properly licensed or exempt from licensure. No advice may be rendered by Stordahl Capital Management unless a client service agreement is in place. Stordahl Capital Management, Inc provides links for your convenience to websites produced by other providers or industry-related material. Accessing websites through links directs you away from our website. Stordahl Capital Management is not responsible for errors or omissions in the material on third-party websites and does not necessarily approve of or endorse the information provided. Users who gain access to third-party websites may be subject to the copyright and other restrictions on use imposed by those providers and assume responsibility and risk from the use of those websites. Please note that trading instructions through email, fax, or voicemail will not be taken. Your identity and timely retrieval of instructions cannot be guaranteed. Stordahl Capital Management, Inc. manages its clients’ accounts using a variety of investment techniques and strategies, which are not necessarily discussed in the commentary. Investments in securities involve the risk of loss. Past performance is no guarantee of future results.
Copyright (c) 2024 Clearnomics, Inc. All rights reserved. The information contained herein has been obtained from sources believed to be reliable, but is not necessarily complete and its accuracy cannot be guaranteed. No representation or warranty, express or implied, is made as to the fairness, accuracy, completeness, or correctness of the information and opinions contained herein. The views and the other information provided are subject to change without notice. All reports posted on or via www.clearnomics.com or any affiliated websites, applications, or services are issued without regard to the specific investment objectives, financial situation, or particular needs of any specific recipient and are not to be construed as a solicitation or an offer to buy or sell any securities or related financial instruments. Past performance is not necessarily a guide to future results. Company fundamentals and earnings may be mentioned occasionally, but should not be construed as a recommendation to buy, sell, or hold the company's stock. Predictions, forecasts, and estimates for any and all markets should not be construed as recommendations to buy, sell, or hold any security--including mutual funds, futures contracts, and exchange traded funds, or any similar instruments. The text, images, and other materials contained or displayed in this report are proprietary to Clearnomics, Inc. and constitute valuable intellectual property. All unauthorized reproduction or other use of material from Clearnomics, Inc. shall be deemed willful infringement(s) of this copyright and other proprietary and intellectual property rights, including but not limited to, rights of privacy. Clearnomics, Inc. expressly reserves all rights in connection with its intellectual property, including without limitation the right to block the transfer of its products and services and/or to track usage thereof, through electronic tracking technology, and all other lawful means, now known or hereafter devised. Clearnomics, Inc. reserves the right, without further notice, to pursue to the fullest extent allowed by the law any and all criminal and civil remedies for the violation of its rights.