The Week in Review: March 11, 2024
A Clear as Mud Jobs Report
On Friday, the U.S. Bureau of Labor Statistics (BLS) reported that employers added 275,000 net new jobs in February. The hiring boom continues, right? Well, it’s not quite that simple.
Let’s dive in. January’s red-hot increase of 353,000 was revised lower to a still-strong 229,000. But that’s an unusually large downward revision. A more comprehensive review uses the 3-month moving average, which is simply an average of the last three months (Figure 1).
It smooths away much of the monthly noise. It reflects an acceleration in new jobs.

If that were the end of the story, we could conclude the labor market is solid. However, the unemployment rate rose from 3.7% in January to 3.9% in February. It’s still low, but it’s at the highest reading since January 2022 (Figure 2).
How does the jobless rate rise when the number of jobs increases?
Nonfarm payrolls are derived from the Establishment Survey, a survey of businesses. The unemployment rate is taken from a separate survey called the Household Survey.

In part, more people are returning to the labor force following the pandemic; higher legal immigration may also be contributing.
Employment in the Household Survey has been down in three of the last four months (Figure 3), a notable contradiction from what happened to nonfarm payrolls.

It’s unclear which survey best reflects the overall state of the labor market. Over a longer period, they tend to line up.
That said, the employment number is typically more volatile in the Household Survey than nonfarm payrolls, as illustrated in Figure 3, so economists focus on nonfarm payrolls when reviewing job trends.
The job openings report from the U.S. BLS still highlights that job openings remain high. Despite a number of high-profile layoff announcements, first-time claims for unemployment insurance from the Department of Labor remain low.
Besides, much of the data doesn’t point to significant economic weakness.
Let’s let the two employment numbers sort themselves out, i.e., see how this plays out.
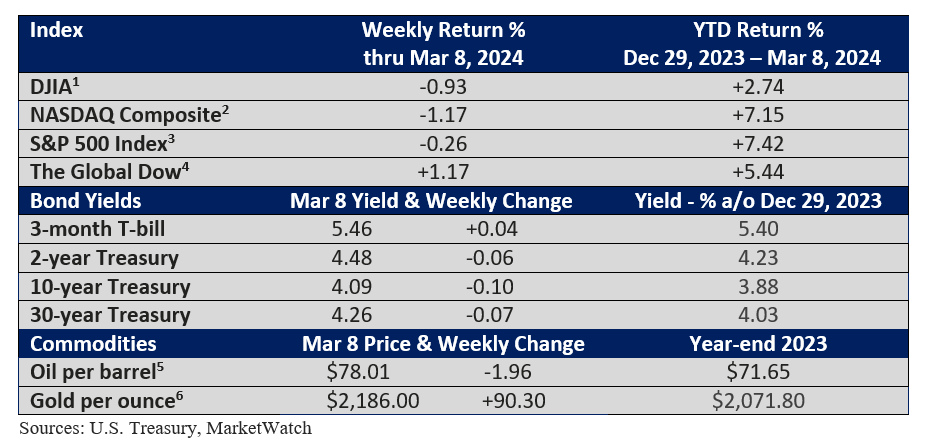
Market Summary
Two for the Road
Some bearish investors believe that U.S. stocks are in a bubble. Since 1974, the S&P 500 has risen 100% or more during the three years that preceded every bubble peak. Despite the wild ride that stocks have been in over the past three years, the S&P 500’s performance during this period is up 31%, which is only slightly better than the average three-year rolling return of 29%. - Yahoo! Finance, February 27, 2024
For every vehicle it sold in the 4th quarter of 2023, the EV automobile manufacturer Rivian lost $43,373. - The Wall Street Journal, February 21, 2024
Please do not hesitate to contact me with any questions or concerns. I hope you have a wonderful week!
Bill Stordahl, CFP®
Managing Director
Stordahl Capital Management
This information should not be construed as investment, tax, or legal advice. This commentary reflects the personal opinions, viewpoints, and analyses of the Stordahl Capital Management, Inc. employees providing such comments and should not be regarded as a description of advisory services provided by Stordahl Capital Management, Inc. or performance returns of any Stordahl Capital Management Inc. Investments client. The views reflected in the commentary are subject to change at any time without notice. Nothing in this piece constitutes investment advice, performance data, or any recommendation that any particular security, portfolio of securities, transaction, or investment strategy is suitable for any specific person. Any mention of a particular security and related performance data is not a recommendation to buy or sell that security. Accessing websites through links directs you away from our website. Stordahl Capital Management is not responsible for errors or omissions in the material on third-party websites and does not necessarily approve of or endorse the information provided. Users who gain access to third-party websites may be subject to the copyright and other restrictions on use imposed by those providers and assume responsibility and risk from the use of those websites. Please note that trading instructions through email, fax, or voicemail will not be taken. Your identity and timely retrieval of instructions cannot be guaranteed. Stordahl Capital Management, Inc. manages its clients’ accounts using a variety of investment techniques and strategies, which are not necessarily discussed in the commentary. Investments in securities involve the risk of loss. Past performance is no guarantee of future results
1. The Dow Jones Industrials Average is an unmanaged index of 30 major companies which cannot be invested into directly. Past performance does not guarantee future results.
2. The NASDAQ Composite is an unmanaged index of companies which cannot be invested into directly. Past performance does not guarantee future results.
3. The S&P 500 Index is an unmanaged index of 500 larger companies which cannot be invested into directly. Past performance does not guarantee future results.
4. The Global Dow is an unmanaged index composed of stocks of 150 top companies. It cannot be invested into directly. Past performance does not guarantee future results.
5. CME Group front-month contract; Prices can and do vary; past performance does not guarantee future results.
6. CME Group continuous contract; Prices can and do vary; past performance does not guarantee future results.