The Week in Review: February 20, 2024
Price Check
The road to price stability was never expected to be a straight line. The latest numbers show that the road isn't even paved.
Investors hit an unexpected pothole after the U.S. Bureau of Labor Statistics (BLS) reported January’s Consumer Price Index (CPI).
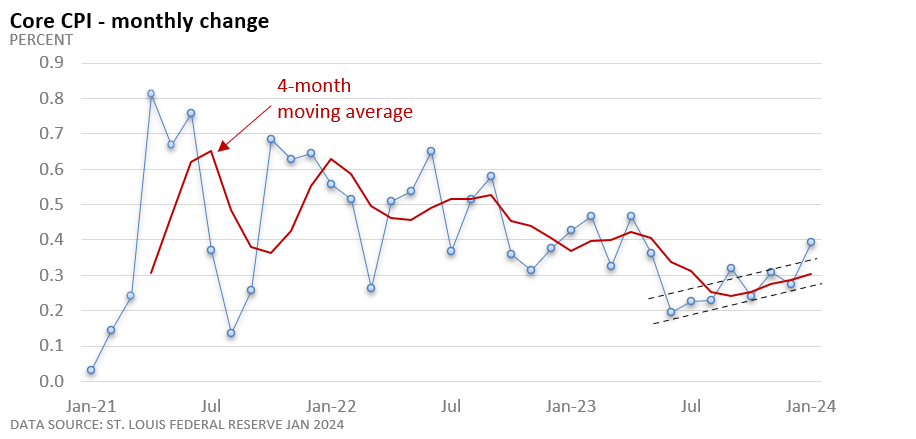
The CPI rose 0.3% in January. It slowed from 3.4% year-over-year in December to 3.1% in January. The core CPI, which minuses food and energy, rose 0.4% in January. The annual rate held at 3.9%.
In both cases, the monthly rate came in 0.1 percentage points above expectations, per the Wall Street Journal. The core rate rose at the fastest pace since last April, according to the U.S. BLS.
Why do analysts emphasize the core rate, which excludes food and energy?
Food and energy can sometimes be volatile. The core rate provides a better picture of underlying inflation trends.
Progress has almost stalled over the last 5 months if we view it from a year-over-year perspective. It has taken 5 months for the core rate to slow from 4.1% to 3.9%. It’s slowing at a snail’s pace.
Reviewing inflation from a monthly perspective makes the data look less confident. As the graphic highlights, the monthly rate is up versus the prior month in 5 of the last 7 months.
If we briefly look under the hood, we see the tale of two economies. The data show that prices are stable or even falling for consumer goods, while service-sector inflation jumped during January.
Maybe it was simply the “January effect,” as some firms used the calendar to hike prices. We won’t get a clearer picture until next month or April.
While the narrative could change by spring, January’s hotter-than-expected inflation reading will reinforce the idea that the Fed is in no hurry to cut rates.
At a minimum, January highlights that the road to 2% inflation is uneven and, in places, unpaved.
Market Summary

Two for the road:
According to the Federal Reserve, baby boomers hold a massive amount of wealth: The 55.8 million Americans over 65, about 17% of the population, hold $96.4 trillion, which is about half of America’s Wealth-Business Insider, October 18, 2024
Nvidia’s market cap is now over $200 billion higher than all the companies in the S&P 500 Energy sector…combined. Meanwhile, the total net income of the Energy sector is $147 billion vs $19 billion for Nvidia. - Bilello.blog, February 13, 2024
Please do not hesitate to contact me with any questions or concerns. I hope you have a wonderful week!
Bill Stordahl, CFP®
Managing Director
Stordahl Capital Management
This information should not be construed as investment, tax, or legal advice. This commentary reflects the personal opinions, viewpoints, and analyses of the Stordahl Capital Management, Inc. employees providing such comments and should not be regarded as a description of advisory services provided by Stordahl Capital Management, Inc. or performance returns of any Stordahl Capital Management Inc. Investments client. The views reflected in the commentary are subject to change at any time without notice. Nothing in this piece constitutes investment advice, performance data, or any recommendation that any particular security, portfolio of securities, transaction, or investment strategy is suitable for any specific person. Any mention of a particular security and related performance data is not a recommendation to buy or sell that security. Accessing websites through links directs you away from our website. Stordahl Capital Management is not responsible for errors or omissions in the material on third-party websites and does not necessarily approve of or endorse the information provided. Users who gain access to third-party websites may be subject to the copyright and other restrictions on use imposed by those providers and assume responsibility and risk from the use of those websites. Please note that trading instructions through email, fax, or voicemail will not be taken. Your identity and timely retrieval of instructions cannot be guaranteed. Stordahl Capital Management, Inc. manages its clients’ accounts using a variety of investment techniques and strategies, which are not necessarily discussed in the commentary. Investments in securities involve the risk of loss. Past performance is no guarantee of future results
1. The Dow Jones Industrials Average is an unmanaged index of 30 major companies which cannot be invested into directly. Past performance does not guarantee future results.
2. The NASDAQ Composite is an unmanaged index of companies which cannot be invested into directly. Past performance does not guarantee future results.
3. The S&P 500 Index is an unmanaged index of 500 larger companies which cannot be invested into directly. Past performance does not guarantee future results.
4. The Global Dow is an unmanaged index composed of stocks of 150 top companies. It cannot be invested into directly. Past performance does not guarantee future results.
5. CME Group front-month contract; Prices can and do vary; past performance does not guarantee future results.
6. CME Group continuous contract; Prices can and do vary; past performance does not guarantee future results.